

Official distributor for Magicmotorsport tuning equipment for Australia and New Zealand.
1300 088 726
Email: [email protected]
Zuce Tech
1/70 Flinders Parade North Lakes QLD 4509
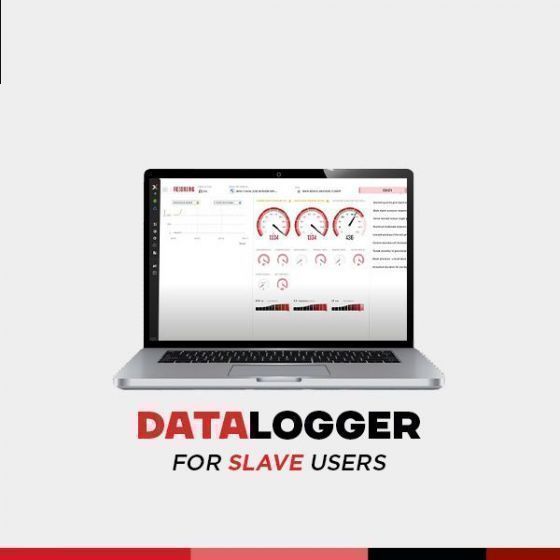
Flex Datalogger Slave
$995.00 inc. GST
Empowers professional tuners to monitor and record up to 2,000 vehicle parameters with data sampling rates up to 50Hz, ensuring precise control during modifications.
Description
The Flex Datalogger Slave is an indispensable tool for professional tuners, providing comprehensive monitoring and recording capabilities for vehicle parameters during modification operations.
Key Features:
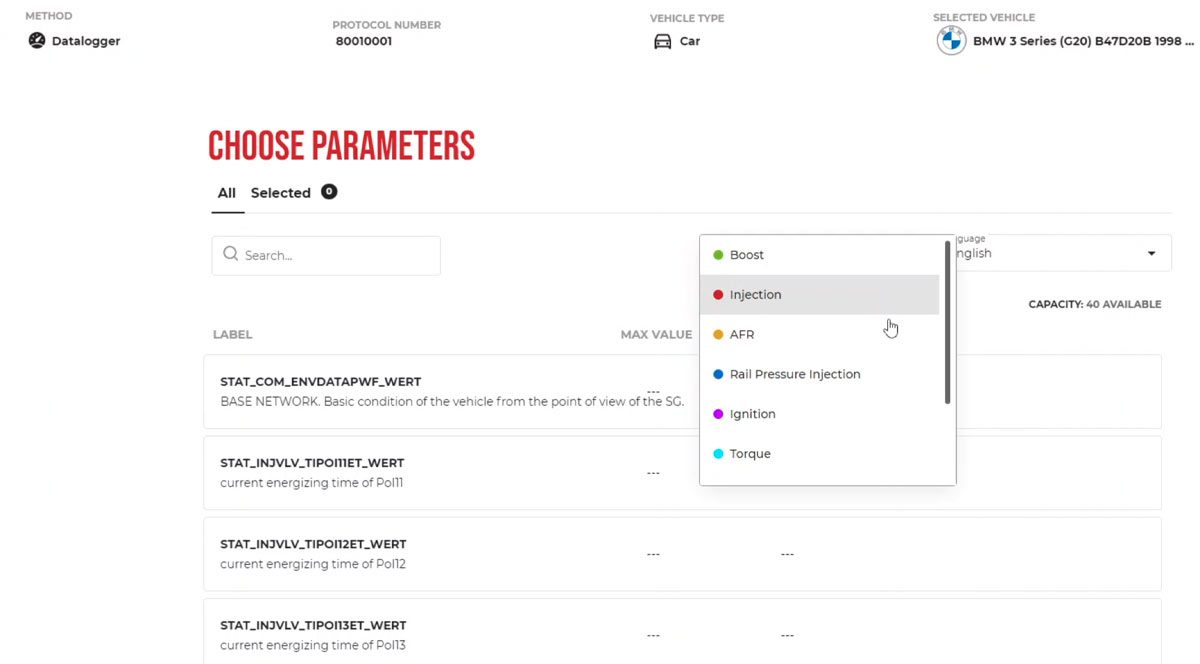
- Extensive Parameter Monitoring: Analyze between 50 to 2,000 switchable sensors, depending on the vehicle model.
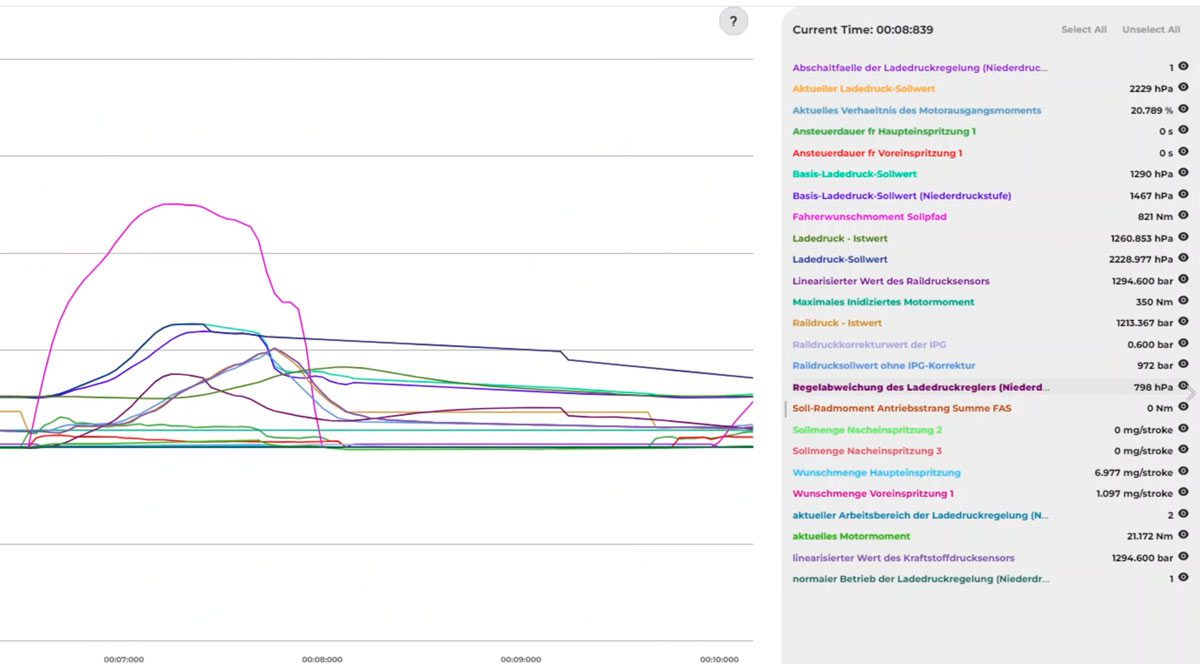
- Customizable Display Modes: Each sensor can be viewed in five different modes: graph, numerical value, linear gauge, large gauge, and small gauge.
- High-Speed Data Sampling: In Plus mode, record data with sampling rates up to 50Hz, ensuring detailed and accurate data collection.
- Automatic Sensor Grouping: The software automatically groups commonly used parameters in default mode, minimizing configuration time and enhancing user experience.
- Seamless Data Sharing: Share and view recorded data from any device through an online panel, compatible with both desktop and portable devices.
Technician Feedback:
★★★★★ “The Flex Datalogger has significantly enhanced our tuning precision, allowing us to monitor a vast array of parameters in real-time.” – DICorse
★★★★☆ “Its high-speed data sampling and customizable display modes make it an invaluable tool for any professional tuner.” – CaracalTech
★★★★★ “The automatic sensor grouping feature saves us a lot of time during configuration, making the tuning process more efficient.” – Viezu
Additional Information:
To configure your Datalogger, select the desired vehicle from the compatibility list, connect the OBDII cable (FLX2.10), and follow the checklist steps to perform a thorough test. Choose the most suitable sensors and values for your analysis, configure their display, and proceed with your recording.
The Flex Datalogger Slave is an essential tool for professional tuners, offering extensive parameter monitoring, customizable display modes, high-speed data sampling, and seamless data sharing capabilities. Its user-friendly interface and automatic sensor grouping feature streamline the tuning process, making it more efficient and precise.
By integrating this package into your operations, you can enhance your tuning services and maintain a competitive edge in automotive performance optimization.
For a visual demonstration of its features and capabilities, please refer to the video overview provided above.
Once the test is completed, use the online chart to view and analyze the recording. You can share measurements with other users at any time by generating a shareable link through the online panel.
Flex 6.14.0.0 is now realityThe best ally for each professional tuner is to always have every single parameter of the vehicle under control during modifying operations:
|
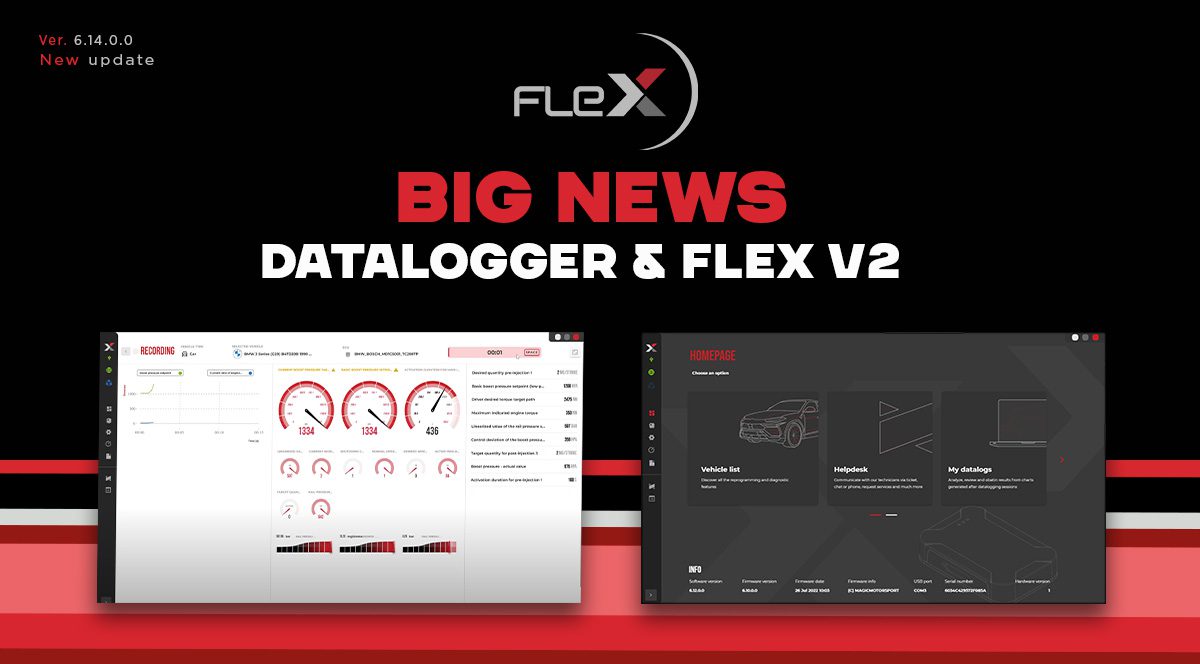 |
Flex V2Completely redesigned graphic interface |
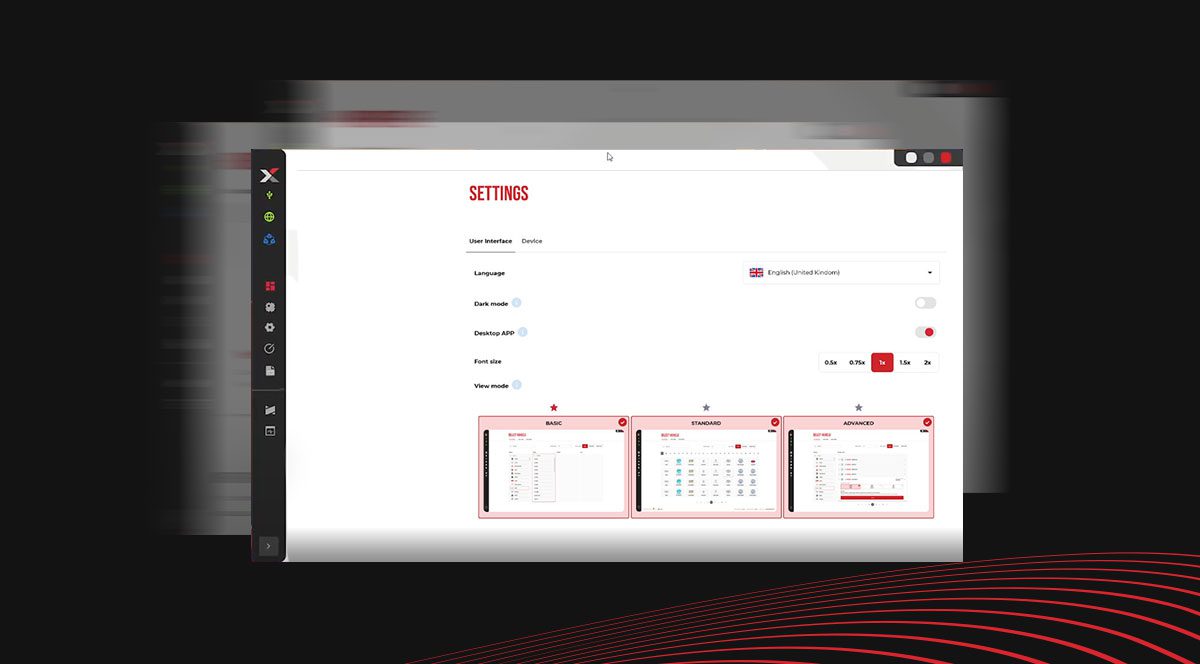
Windows Desktop AppFrom now on, you’ll be able to add the Flex V2 app to your Windows taskbar; just open the Flex setting to enable and disable this switch.You can return to view your software on the browser at any time simply by returning the configuration to its original state. The desktop application improves the overall experience. Remember that an internet connection is required to work with Flex. |
 |
Dark-modeIn addition, it also comes the dark mode for your Flex software, which allows clear text display even with less bright screens and
|
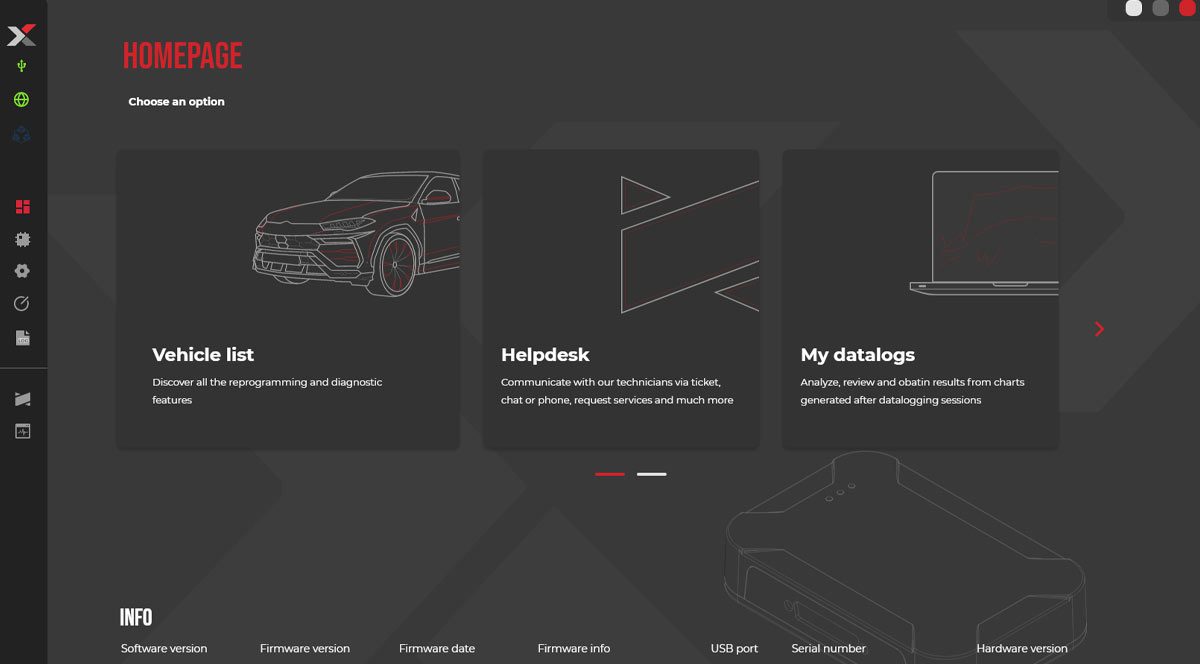 |
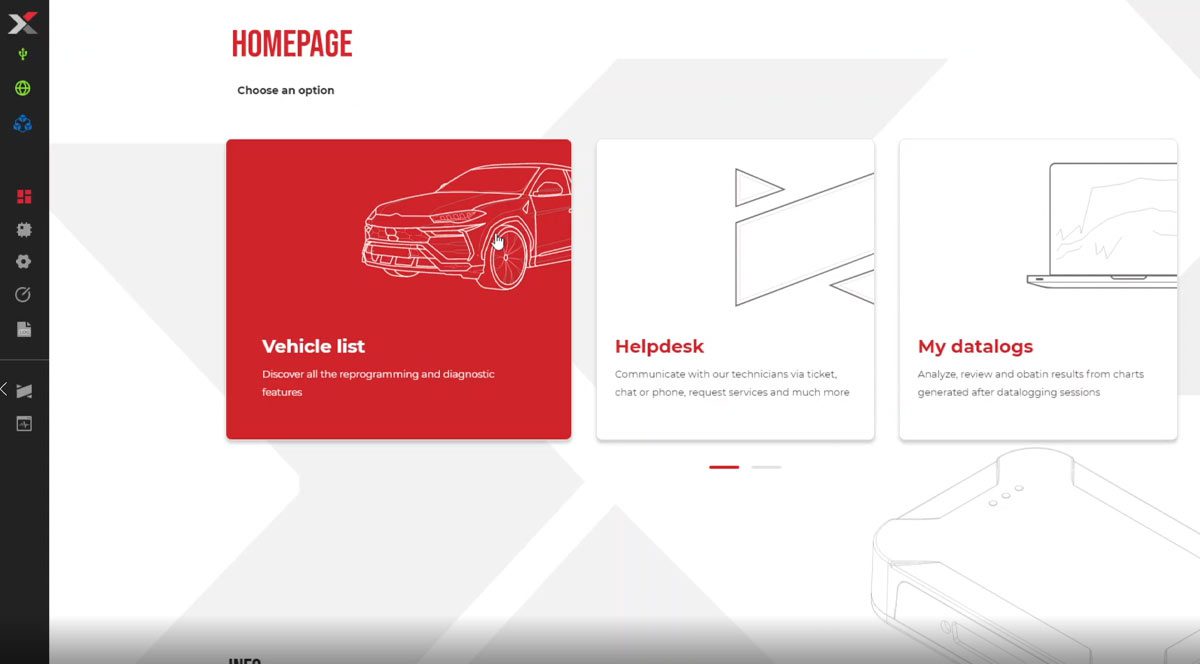
New dashboardEven more user-friendly and intuitive. The software home page has been re-engineered to give access to all
|
 |
Datalogger PlusThe best ally for each professional tuner |
Configure your DataloggerCheck the compatibility on the vehicle list, so select the needed vehicle. Connect the OBDII cable (FLX2.10)
|
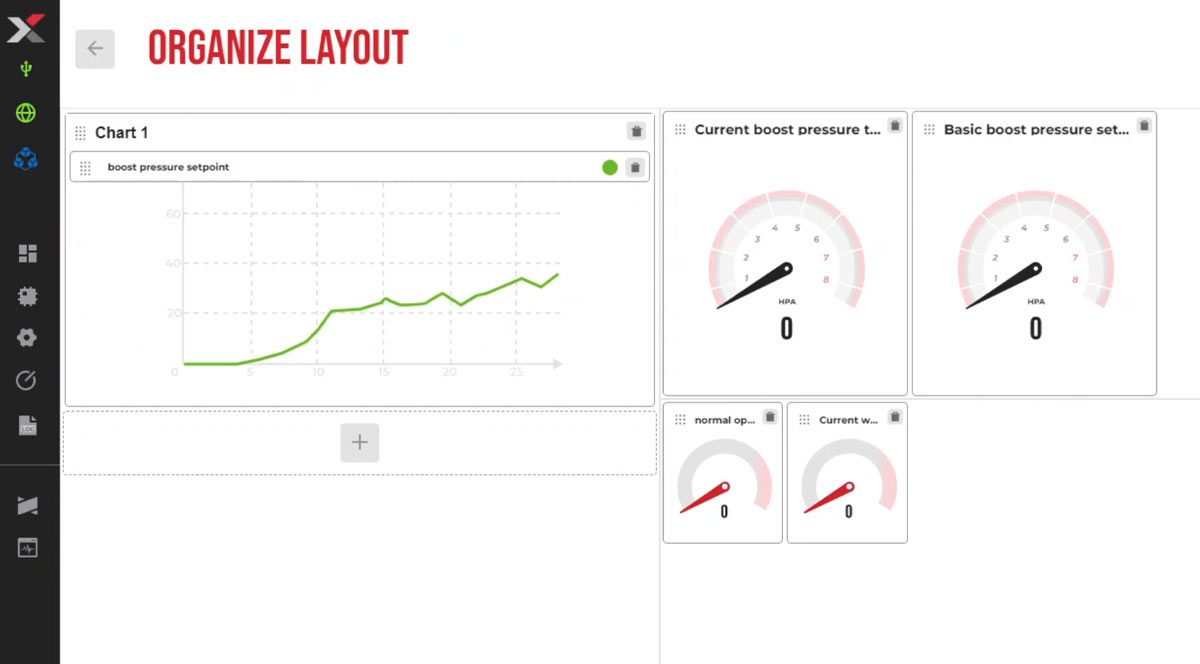 |
Choose the most suitable parametersThe right amount of parameters that could be analyzed depends on the selected model of vehicle, ranging between 50 and 2000
|
 |
Data sampling up to 50Hz in Plus modeThe Plus version allows you to record with sampling up to 50Hz.It is possible to share and view your data from any device when connected to the ECUs, This is to offer maximum efficiency in all conditions and with a sampling rate of up to 20ms. |
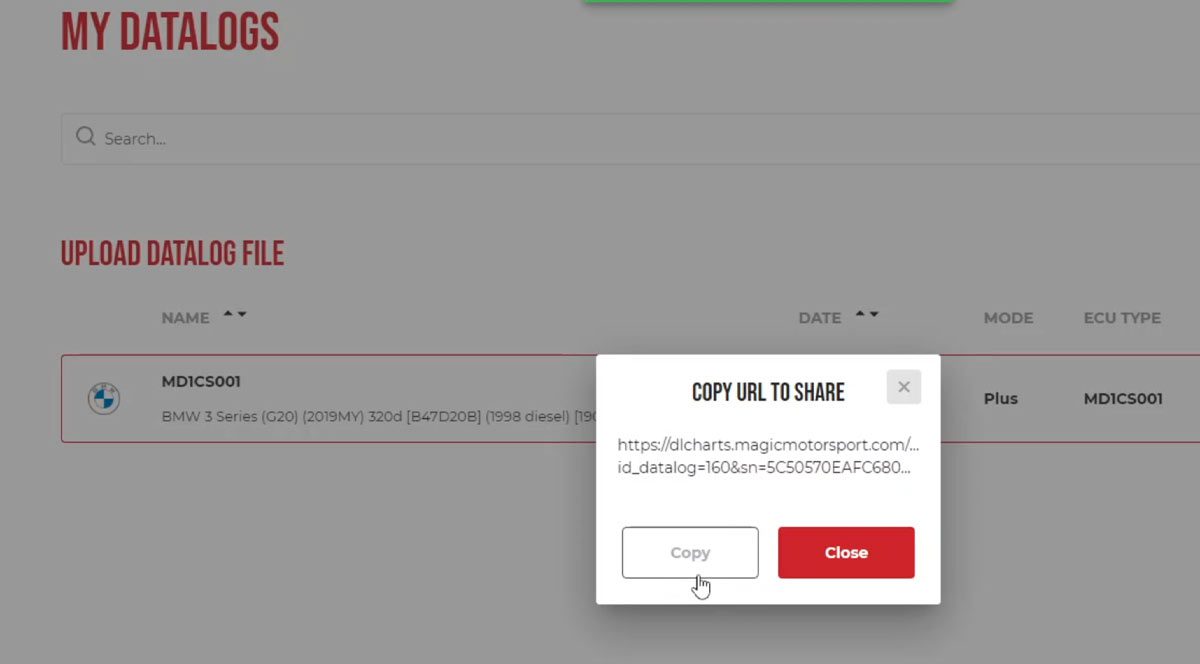 |
Share and view data directly from the online panelUse the online chart to view and analyze the recording once the test is finished.Share measurements with other users at any time. By clicking on the share button, the share link will be generated. The online chart is compatible with any kind of desktop and portable device. |
 |
Related products
-
 This product has multiple variants. The options may be chosen on the product page
StageX Plus – Vehicle Remapping Software
Price range: $1,634.00 through $3,106.00 inc. GST